With the development of online retailing, artificial intelligence is becoming increasingly important for the fashion industry.
According to a report on electronic commerce, the sale of products online in the third quarter of 2022 increased by 16.8% compared to the third quarter of 2021.
This new way of consuming has led to the emergence of new strategies, some of which involve artificial intelligence. These machine learning algorithms can be used to increase sales, improve product organization and labeling, predict the customer journey, and certify the authenticity of branded goods sold online.
The applications of AI for fashion are numerous and respond to real needs, but these developments also come with their own technological challenges: read more.
One of the key challenges for online stores is to improve tagging when consumers search for items. This requires the ability for AI systems to automatically extract information from each image to correctly classify products for sale by color or brand, for example.
Some platforms give consumers the opportunity to sell online, such as marketplaces. In this case, it is the seller who has to take a photo of his item and publish it on the platform.
However, the photo published is not necessarily of good quality or rarely contains a white background, which can "confuse" the AI and more precisely the classification model and therefore introduce robustness problems.
In this case study, we will train several neural network models on images that can be found on websites, i.e. photos with a white background and the same orientation.
Then, using Saimple, we'll evaluate the robustness of these models by progressively perturbing the images by increasing the noise on them.
Saimple will also provide us elements of explicability by identifying the zones of importance of the image for the model decision-making.
The dataset chosen for this case study is called UT Zappos50K. This is a large dataset of 50,091 images of shoes from catalogs collected from Zappos.com.
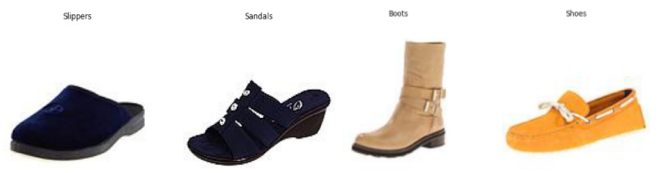
The images are divided into 4 main categories:
Class 0: Sandals,
Class 1: Slippers,
Class 2: Shoes,
Class 3: Boots.
Note: The categories in this dataset are unbalanced, with the 'Shoes' class containing 30,217 images, it alone represents 60% of the dataset.
Because of that, the model can then tend to classify the images in the 'Shoes' class and this could cause a problem for the model in recognising images from other classes.
Therefore, the dataset should be balanced to avoid bias.
Throughout the selected dataset, the shoes are centered on a white background and photographed in the same orientation. This can represent another bias in the training of the model.
In order to reduce the impact of this bias, data augmentation is a possible solution, as it allows the classes to be rebalanced. This is what we have chosen and used on the training data.
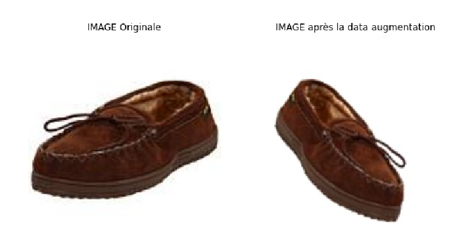
Data augmentation is a dataset improvement technique that uses a sample of images from under-represented classes to generate new images, thereby balancing the dataset.
To perform data augmentation, there are a number of input transformation methods that can be used, such as:
Resize the image: enlarge or shrink the image;
Fill pixels (i.e. fill in missing spaces in the resized image);
Changing the perspective of the image.
Example of data augmentation
In this case study, three model training approaches are discussed:
no-DA: a model without data augmentation,
DA-slippers: a trained model where only the underrepresented class, "Slippers", has been augmented,
all-DA: a trained model where all classes have been augmented.
In order to compare the three models, several analyses will be taken into account:
The confusion matrix,
The relevance and dominance obtained with Saimple,
The perturbations of the images using Gaussian noise,
The delta max obtained with Saimple.
As a reminder:
Relevance: identifies the important pixels that allowed the model to classify the image. A pixel is considered important if a value called "relevance" is higher than the average. The more this value tends towards red or blue, the more the pixel is considered important, either as a positive element in the identification of this class or as a negative element to the other classes.
Dominance: Indicates, in the form of intervals, the values belonging to a possible class of the model in the space of the considered inputs. The dominance graph makes it possible to determine whether a class is dominant, i.e. whether the predicted value of this class will always be higher than the values of the other classes.
A dominant class ensures that the model's decision (good or bad) remains stable. Therefore, the network will always predict the same class for all images that can be generated from the original image and the given noise.
It is important to note that the interval values of the classes can overlap without losing the dominance property. Since the interval representation is a projection of the possible values, it does not take into account the constraints that define the values being compared.
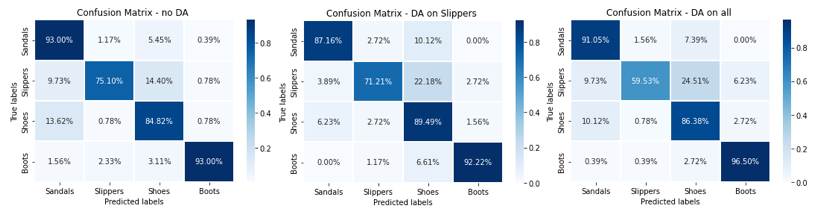
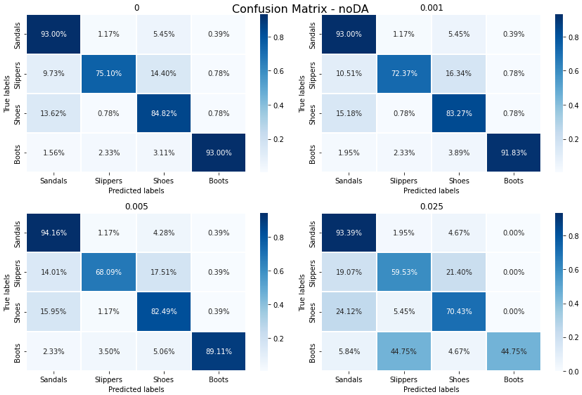
First, the confusion matrices of each model on the test data set are analyzed.
For all three models, the confusion matrices are approximately equivalent for all classes except for the Slippers class, for which there is a decrease in correctly classified images with data augmentation.
This result is surprising because it is usually expected that data augmentation will improve the classification scores (also called accuracy). Yet the percentages of the slipper class decrease. Nevertheless, this result can be understood later with the help of the elements brought by the different analyses carried out.
The point to bear in mind is that accuracy is not the only metric that must be taken into account to determine the performance of an algorithm.
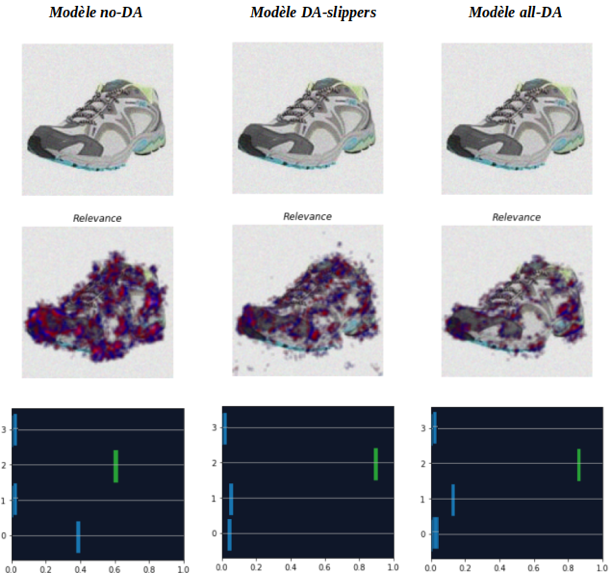
To continue the analysis, an image of the "Shoes" class is selected in order to visualize the results of Saimple for each model concerning relevance and dominance.
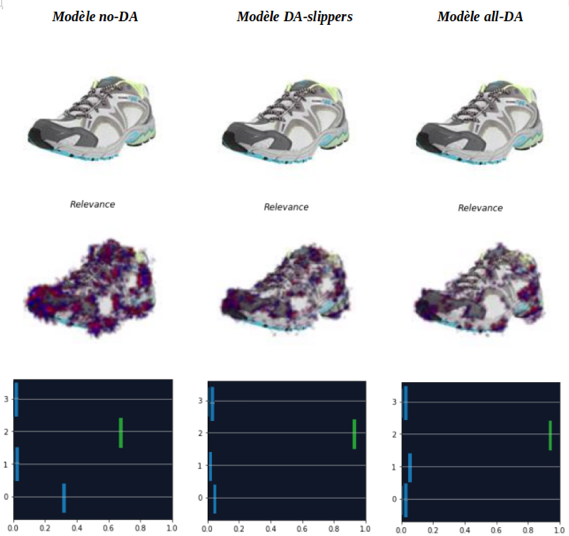
Below are the Saimple results on relevance and dominance for the three models compared:
The results indicate that for the all-DA model the relevance seems to be much more accurate than for the other models, as shown by the difference in pixel concentrations.
The same is true for the dominance of the all-DA model, which appears to be more stable, with the green line being further away from the blue lines of the other classes.
The all-DA model seems to focus more on the contour of the shoe, which is the element considered to be the main one for the differentiation of the classes.
Regarding dominance, the graphs indicate that all models correctly classified the image. But the dominance of the "Shoes" class is more distinct for the models that were trained with data augmentation.
Indeed, for the all-DA and DA-slippers models, the dominance score for class 2 ("shoes") is further away from the dominance scores of the other classes than for the no-DA model.
This first analysis allowed us to identify, with the help of relevance and dominance, that the models trained with data augmentation are in fact better at classifying this image, even if the accuracy may appear to be lower overall.
Subsequently, Gaussian noise with different intensities is added to the example image to observe the behavior of the models in the face of perturbations.
Gaussian noise was selected because it represents a low-light environment within a photo shoot, which may be the case for photos of online apparel or footwear items.
Three levels of Gaussian noise are applied to the reference image. These intensity levels correspond to the different variances used to apply noise to the images. Intensity 0 corresponds to the original image.
The three models are compared for each noise level and the Saimple results are examined to understand the difference between the three models.
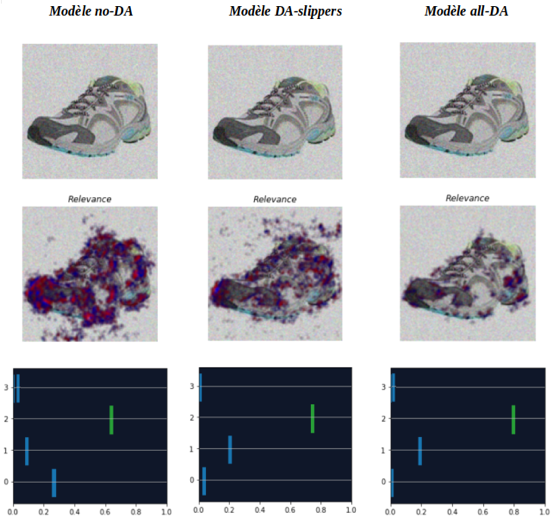
For this first level of noise, the dominance results are similar to the previous results. The relevance is on the shoe for all three models but there is a small difference with the DA-slippers model.
Indeed, the relevance for the latter is slightly concentrated on the background of the image.
It is assumed that as the intensity of the noise increases, the models will focus more on the background of the image, which could change its classification.
The dominance indicates that the three models, as before, correctly classify the image. However, a difference is still observed, with this time the model without data augmentation having a much less precise relevance than the others.
The dominance of the latter is also less distinct compared to the other models.
For this level of noise intensity, the relevance produced by Saimple indicates that the models are starting to take the shoe background into account; except for the all-DA model which therefore appears to be more robust than the others.
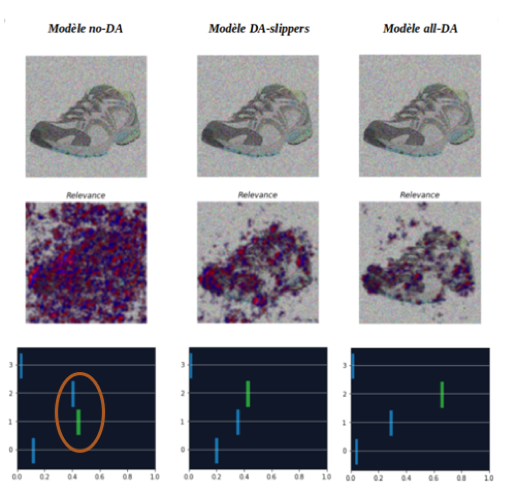
At this level of noise, the first thing to note is the change in classification of the shoe in the case of the no-data augmentation model (represented by the orange circle). The dominance indicates that the no-Da model misclassifies the image as "slippers".
For the DA-slippers model, the membership scores are also very close, which is a sign of significant risk of misclassification. For the all-DA model, the scores are still quite distinct.
At this level of noise, the relevance of the no-DA model is totally scattered and no longer distinguishes the shoe, which explains why the model no longer classifies the image correctly. For the other two models, the relevance is on the shoe and slightly on the background, but the all-DA model remains less impacted by the application of noise. Thus, this level of noise intensity confirms the hypothesis, made during the evaluation at intensity level 0.005, that the all-DA model is more robust than the other models.
To summarise, it can be noted that the algorithm having been trained on the dataset with data augmentation on all classes (all-DA) still seems to focus relatively well on the whole shoe. There does not appear to be any watermark or bias either. However, the noisier the image, the more difficult it is for the model to locate the features of the shoe that allow it to correctly classify the image, which is still consistent. This difficulty is confirmed by the dominance evaluation, which shows that the noisier the model, the greater the risk of overlapping classes (green line further and further away from 1) and therefore the more possible classification errors there will be.
It should be noted that the dominance assessment offered by Saimple also makes it possible to obtain the exact noise threshold at which the model would no longer be considered sufficiently robust. It also offers the possibility of knowing precisely which classes are most likely to be confused. Thus, with the metrics obtained and according to the levels of satisfaction defined, it is possible to decide to change the parameters of the model or to re-train it by enriching the data set. New evaluations could then be carried out with Saimple in order to monitor the evolution of performance.
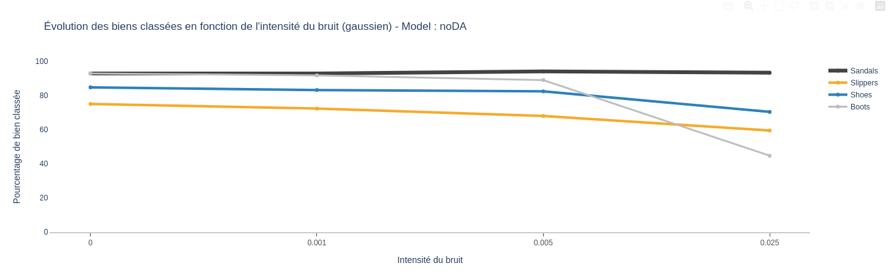
In this section, we will look at the results of the confusion matrices for the test dataset of each model.
First, the diagonals of the confusion matrices are analyzed and plotted. It will thus be possible to observe the classification rate in relation to the evolution of the intensity of the Gaussian noise.
In a second step, the whole confusion matrix is analyzed to visualize which class undergoes classification changes.
The graph above shows that, for the whole test data, the percentage of well classified images remains stable until intensity 0.001. However, after 0.001, the curves of the different classes tend to decrease slightly, except for the class "sandals". At the transition from intensity 0.005 to 0.025, the percentage of correct classifications for the "Boots" class decreases significantly, in contrast to the percentages for the other classes, from 85% to less than 50%. Only the curve for the "Sandals" class remains constant, indicating that the model is robust only for this class.
Now let's analyze the confusion matrices:
The values of the curves correspond to the diagonals of these matrices. They show that the proportion of well classified images decreases as the noise intensity increases. A significant decrease can be seen in the boot class, where almost half of the images in this class are classified as slippers. The question may then arise: why does the model tend to confuse images of the "Boots" class with images of the "Slippers" class?
This is not an easy question to answer, but relevance may allow elements of explicability to be introduced to enable understanding.
However, this use case focuses mainly on robustness. Therefore, only hypotheses are made, but their verification is not dealt with in this use case.
The most likely hypothesis is that the noisier the model, the less recognisable the features that help classification. Thus, the features that help to recognise the boots must be mainly affected, which greatly reduces the classification score. The feature that should be most resistant to noise should certainly be the shoe shape feature. However, slippers are the most classic shoe shape and can be considered as the basis for any other shoe. Therefore, as the features that allow classification are lost, the algorithm should no longer correctly recognise boots and therefore classify them as the "classic" shoe type, i.e. slippers.
As before, a significant decrease is observed from intensity 0.005 onwards, but unlike the no-DA model, the proportions of all classes except for the "Slippers" class decrease until they reach less than 50%. By analyzing this graph, it is clear that training the model by performing a data augmentation on a single class is not recommended.

The confusion matrices confirm that data augmentation on only one class does not generally make the model more robust to noise, but tends to bias the classification towards the augmented class. Indeed, the intensity confusion matrix of 0.025 indicates that the model tends to classify the images of all classes as "slippers".
This classification tends to confirm the hypothesis that the class "Slippers" is a basic class with a shape that can be found in all shoes. The fact that the data augmentation is performed only on this class also implies that the slippers will be found in many positions and that, overall, the more noise there is, the more the shoe will become a "stain", which will be closer to the simplest shape: the images of the "slippers" class. However, even if the stain is vertical, as in the case of the boots, there will also be images of the "Slippers" class which have undergone a rotation and for which the stains of the boots can therefore be approximated.
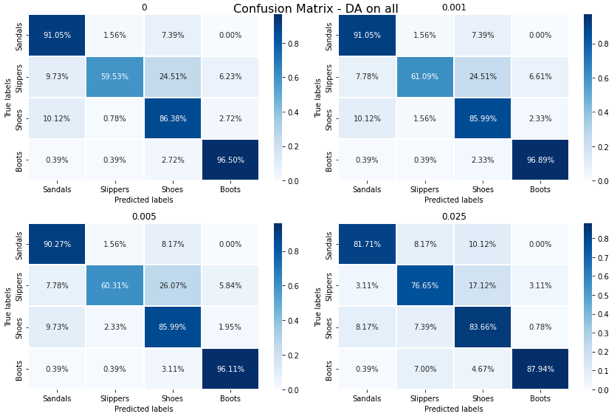
The graph, above, shows that the percentages of well ranked images remain stationary up to 0.005. After that, the curve for the "Slippers" class increases, which may seem a very curious result, while the curves for the other classes decrease slightly.
The confusion matrices, above, show a slight increase in the "Slippers" class images. But overall, with the model trained with data augmentation on all classes, the results are much better from an accuracy point of view.
Again, the increase in the "Slippers" class can be linked to the hypothesis of deterioration in feature recognition, due to high noise levels.
Now, let us study the stable space corresponding to the study of the delta max on the example image to visualize the robustness of the different models.
The delta max refers to a particular delta value corresponding to the noise amplitude for which we can prove the dominance of a classifier network.
This graph shows the evolution of delta max values as a function of intensity for each model: no-DA, DA-Slippers and DA-all.
For the example image, the delta max value is higher for the DA-all model, which implies that the DA-all model seems more robust than the other two models.
It would be interesting to continue this study by performing a delta max search on the whole test data.
In conclusion, this use case has shown that data augmentation is beneficial in improving the robustness of a model.
We should not only rely on the accuracy of a model. In fact, data augmentation slightly decreased the accuracy scores. However, the dominance and relevance of the model allowed us to see that the augmented models are more robust and more accurate in identifying the important features for classification. To improve the accuracy scores of the algorithm, it would be possible to further enrich the dataset.
However, even if data augmentation was beneficial for the model, it was beneficial when all classes were augmented. In fact, performing data augmentation on only one class introduced a bias that pushed the images of the other classes to be classified as part of the augmented class, since the shape and position of the shoes are certainly important features. It is therefore necessary to try to perform the data augmentation on all the classes and to have an equivalent amount of data for each class.
The results of the Saimple tool made it possible to follow the performance of a data augmentation and its evolution over different training sessions. It provided explanatory and robustness elements, evaluating the level of noise that the algorithm can withstand and visually demonstrating the elements that are important for image classification. The addition of the delta max evaluation function also provides important information about the model's stable space. Indeed, the latter makes it possible to determine the noise amplitude for which it is possible to demonstrate the dominance of a classifier network.
But Saimple also provides other information, such as: elements concerning the classes that can be confused, the exact noise threshold above which there is a risk of classification errors, or whether the algorithm has been subjected to biases.
Overall, this use case helps to understand how to improve the robustness of classification algorithms in fashion. This is particularly important for e-commerce sites, which can use more efficient classification algorithms to classify items even if the photos of the items are not perfect.
If you are interested in Saimple, want to know more about the use case or if you want to have access to a demo environment of Saimple:
Contact us : support@numalis.comWritten by Noemie Rodriguez & Baptiste Aelbrecht & Camille Jullian & Arazi Issouffou
Picture credit : Edgar Chaparro